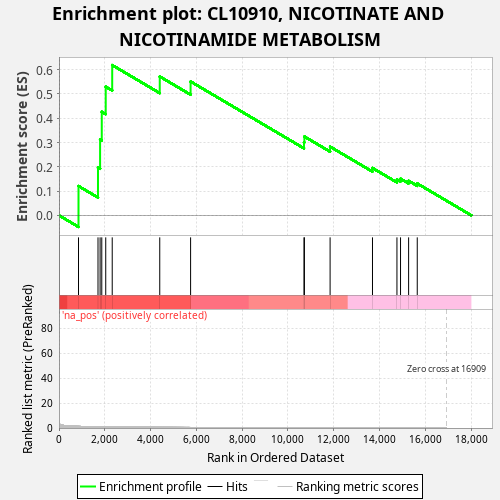
Profile of the Running ES Score & Positions of GeneSet Members on the Rank Ordered List
| Dataset | BreastCancer Custom__BreastCancer_custom-females- |
| Phenotype | NoPhenotypeAvailable |
| Upregulated in class | na_pos |
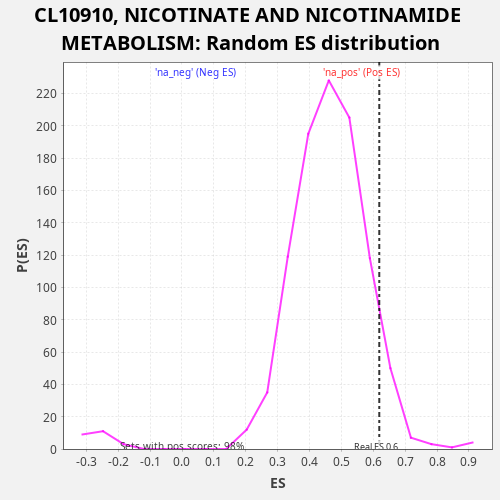
| GeneSet | CL10910, NICOTINATE AND NICOTINAMIDE METABOLISM |
| Enrichment Score (ES) | 0.6186809 |
| Normalized Enrichment Score (NES) | 1.3279266 |
| Nominal p-value | 0.07267144 |
| FDR q-value | 0.78776914 |
| FWER p-Value | 0.789 |
| SYMBOL | RANK IN GENE LIST | RANK METRIC SCORE | RUNNING ES | CORE ENRICHMENT | |
|---|---|---|---|---|---|
| 1 | NUDT12 | 852 | 1.276 | 0.1208 | Yes |
| 2 | NAPRT | 1703 | 0.936 | 0.1969 | Yes |
| 3 | SIRT6 | 1795 | 0.912 | 0.3122 | Yes |
| 4 | NMNAT1 | 1868 | 0.898 | 0.4265 | Yes |
| 5 | SIRT4 | 2041 | 0.855 | 0.5297 | Yes |
| 6 | NNT | 2324 | 0.793 | 0.6187 | Yes |
| 7 | NMNAT2 | 4400 | 0.518 | 0.5717 | No |
| 8 | CD38 | 5747 | 0.411 | 0.5511 | No |
| 9 | QPRT | 10699 | 0.189 | 0.3008 | No |
| 10 | NADK2 | 10717 | 0.188 | 0.3246 | No |
| 11 | NAMPT | 11839 | 0.156 | 0.2829 | No |
| 12 | SIRT5 | 13690 | 0.114 | 0.1951 | No |
| 13 | BST1 | 14758 | 0.092 | 0.1480 | No |
| 14 | NMRK1 | 14915 | 0.089 | 0.1511 | No |
| 15 | NMRK2 | 15268 | 0.082 | 0.1424 | No |
| 16 | NADSYN1 | 15645 | 0.075 | 0.1314 | No |